
Contribution Margin Ratio: What It Is and How to Improve Yours
Revenue gets the spotlight. But contribution margin ratio is what reveals how much of it you truly get to keep. Leading operators, including teams supported by FNT Management, use this metric to guide decisions that actually drive sustainable growth.
It’s one of the most underrated metrics for founders, marketers, and operators especially those scaling products, services, or subscriptions. If you don’t know your contribution margin ratio, you’re flying blind when it comes to pricing, forecasting, and profitability.
Let’s break it down!
What Is Contribution Margin Ratio?
Your contribution margin ratio (CM ratio) measures how much of each dollar in revenue remains after covering variable costs. It answers a fundamental question: after you pay for things that scale with your sales: materials, fulfillment, commissions, how much is left to cover your fixed expenses and generate profit?
Put simply, the CM ratio is the percentage of revenue that actually contributes to covering overhead and earning margin. It's the bridge between gross revenue and net gain.
Formula:
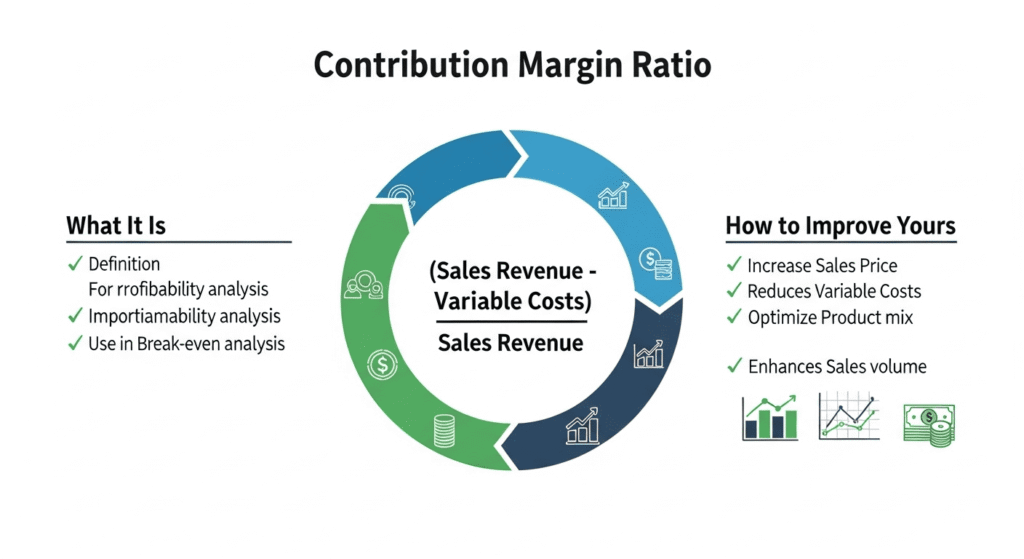
Contribution Margin Ratio = (Revenue – Variable Costs) / Revenue
This formula is flexible and applies whether you're selling physical products, digital services, or subscriptions. What matters is correctly identifying which costs vary with each sale.
Example:
Let’s say you sell a product for $100.
- Materials: $30
- Packaging: $10
- Shipping: $15
- Commission or payment fees: $5
Total Variable Costs = $60
Contribution Margin = $100 – $60 = $40
Contribution Margin Ratio = $40 / $100 = 0.4 or 40%
This means that for every $100 earned, $40 remains after direct costs. That $40 must cover your fixed costs, like rent, salaries, insurance, and what’s left after that is profit.
At scale, this ratio becomes one of your most valuable metrics. A product with a 40% CM ratio needs less volume to hit profitability than one at 20%. It also gives you clearer constraints on how much you can spend to acquire customers while staying cash-flow positive.
Why It Matters
Gross margin shows production efficiency. But contribution margin ratio shows operational viability whether your business model actually works at scale.
It’s the difference between making revenue and keeping enough of it to build, hire, and grow.
Here’s where CM ratio becomes critical:
- Pricing: CM ratio helps you price with purpose. If your variable costs eat up 85% of revenue, a minor pricing mistake can turn a sale into a loss. With a strong CM ratio, you build in a buffer for discounts, commissions, or customer support.
- Profit forecasting: Knowing your CM ratio allows you to reverse-engineer how many units or clients you need to break even, and how much additional profit comes from each new sale. It makes financial modeling faster, clearer, and more reliable.
- Marketing: Every campaign burns budget. Your CM ratio tells you how much you can afford to spend acquiring a customer. If your margin per sale is $40, you might be able to spend $30 on CAC and still be in the black but if it’s $10, your options shrink.
- Product line performance: Not all products pull their weight. CM ratio lets you evaluate which SKUs are profitable at scale and which drag you down. It also shows where to allocate ad spend, inventory, or team resources.
Bottom line: contribution margin ratio isn’t just a finance metric it’s a decision-making tool. Whether you're scaling up, fixing leaks, or deciding which offer to sunset, CM ratio gives you the signal to act with clarity, not guesswork.
What Counts as Variable Cost?
Variable costs change directly with the volume of sales. The more you sell, the more these costs increase. They are tightly tied to each transaction, which makes them essential for calculating your CM ratio.
For physical products, common variable costs include:
- Materials and components: The raw inputs needed to produce your product. If you double your sales, you double your material costs.
- Packaging: Anything used to wrap, protect, or label the product before shipping including boxes, inserts, and branded materials.
- Shipping and delivery: Carrier charges, fuel surcharges, and handling fees that rise with order volume.
- Sales commissions: Payments to reps or affiliates that scale based on revenue or unit sales.
- Credit card fees: Transaction-based fees, typically a percentage of each sale, paid to payment processors.
- Fulfillment charges: Warehousing, picking, packing, and dispatching costs that increase with order frequency and size.
For SaaS and digital services, variable costs behave differently but still exist:
- Onboarding: Human or automated workflows that scale with each new client (e.g., custom setup or live training).
- Cloud infrastructure: Hosting, bandwidth, and storage costs that grow as user volume increases.
- Customer support: Help desk tools or live staff time that grows in line with user base size and activity levels.
These are all costs that would not exist or would drop significantly if you paused all new sales.
Important clarification:
- Fixed costs like rent, salaried staff, insurance, and baseline software subscriptions don’t fluctuate with revenue. That’s why they are excluded from the CM ratio, the metric focuses purely on what moves with each sale.
Accurately categorizing your variable vs. fixed costs is non-negotiable. Misclassify them, and your contribution margin ratio becomes misleading which leads to flawed pricing, incorrect breakeven models, and wasted marketing spend.
Contribution Margin Ratio vs. Gross Margin: What’s the Difference?
While both metrics are essential for understanding business profitability, they serve different purposes, and ignoring either one means missing part of the picture.
| Metric | What It Measures | Includes | Excludes | Use Case |
| Gross Margin | Efficiency of production | Revenue – COGS | Shipping, commissions, CAC | Pricing benchmarks, investor reporting |
| Contribution Margin | Profitability after all variable costs | Revenue – Variable Costs | Fixed costs (rent, salaries) | Operational planning, CAC modeling, scaling |
Why Gross Margin Isn’t Enough
Gross margin tells you how efficiently your product is made. It’s useful for evaluating suppliers, manufacturing processes, and direct cost structures. But it ignores all the "other" expenses that happen post-production like fulfillment, packaging, and transaction fees. That makes it incomplete for real-world strategy.
Example:
- COGS = $40, selling price = $100 → Gross Margin = 60%
- Add $20 shipping + $5 commission → Real contribution = $35 → CM = 35%
If you’re relying only on gross margin, you may think your business is healthier than it really is.
Why Contribution Margin Goes Deeper
Contribution margin includes all variable costs not just production inputs. That makes it a far better measure for day-to-day decisions: marketing budgets, product prioritization, breakeven analysis, and channel strategy.
If a product has a strong gross margin but low contribution margin, it likely suffers from high fulfillment or CAC costs. You may be selling something efficiently but not profitably.
Common Mistakes to Avoid
- Counting fixed costs as variable e.g. including salaried staff in per-unit cost
- Using gross margin for ad spend decisions CAC should be benchmarked against contribution margin, not gross
- Assuming high revenue means high profit CM ratio clarifies whether growth is sustainable
Pro Tip: Always review CM ratio by product line, channel, or cohort. Averages hide underperformers.
Visual Summary
| Product Type | Revenue | COGS | Other Variable Costs | Gross Margin | Contribution Margin |
| T-shirt | $25 | $8 | $9 (shipping, fees) | $17 (68%) | $8 (32%) |
| SaaS subscription | $40 | $0 | $5 (server/support) | $40 (100%) | $35 (87.5%) |
In Practice
Use gross margin to:
- Set baseline pricing thresholds
- Compare vendor or supplier performance
- Report on profitability in financials
Use contribution margin to:
- Decide how much to spend on ads
- Kill or scale product lines
- Forecast breakeven and ROI
You need both but contribution margin is the one that shows whether your revenue turns into results.
Is a Higher Contribution Margin Ratio Better?
Yes. The higher your CM ratio, the more money you retain per dollar of revenue which gives you:
- More room to reinvest
- More pricing flexibility
- Better resilience to cost increases
But context matters. A 60% CM ratio in ecommerce is excellent. In SaaS, it might be low.
What’s a Good Contribution Margin Ratio?
There’s no one-size-fits-all benchmark. What counts as “good” depends heavily on your business model, cost structure, and growth strategy. Still, there are typical ranges by industry, and they can help you spot red flags or opportunities.
| Industry | Typical Target CM Ratio | Notes |
| SaaS | 70–90% | High-margin by nature; recurring revenue, low per-user costs |
| Ecommerce | 25–50% | Thin margins due to shipping, returns, and fulfillment costs |
| Info products | 80–95% | Low overhead; mostly digital delivery, scalable content |
| Manufacturing | 30–60% | Depends on automation, materials, and logistics efficiency |
Pro Tip: Your absolute number is less important than your direction. If you’re improving the CM ratio quarter over quarter, you’re building resilience into your operations.
Also consider business stage:
- Early-stage companies may accept lower CM to gain traction.
- Mature companies should focus on optimizing CM to scale profitably.
Track your own over time. Don’t just benchmark against others to improve yours.
How to Improve Your Contribution Margin Ratio
Let’s get into actionable steps. Improving CM ratio often takes operational fine-tuning, not just bigger revenue.
1. Reduce Variable Costs
A small reduction per unit adds up fast at scale. This isn’t just a cost-saving tactic, it's a direct boost to your margin per sale. Businesses often overlook how much of their revenue quietly slips away through operational leakage.
Let’s break down where you can get that margin back:
- Shipping: Renegotiate with carriers or switch to hybrid delivery models. For example, offering a "standard delivery" option with longer lead time can drastically cut your per-unit cost.
- Materials: Audit every component. Can you substitute or consolidate parts without affecting quality? Even a 3–5% reduction in bill of materials (BOM) makes a big difference at volume.
- Packaging: Branded doesn’t have to mean expensive. Many brands overspend on unboxing aesthetics. Consider right-sizing your packaging or using recycled stock.
- Commissions: If you rely on affiliate or sales reps, shift to commission structures that reward profit, not just volume. A lower-conversion, high-margin SKU might be better for your bottom line than a bestseller that barely breaks even.
Tip: Map your entire cost chain from order to fulfillment. Even minor tweaks in overlooked areas like credit card processing or pick-and-pack costs can have cumulative effects across thousands of transactions.
2. Raise Prices (Carefully)
Sometimes the fastest route to better margins is to charge more. But it has to be strategic, and backed by real customer behavior, not guesses.
Start with these tactics:
- Raise prices on bestsellers: High-performing products often have lower price sensitivity. Small increases won’t drastically impact sales volume, but can meaningfully boost contribution per sale.
- Segmented pricing for new customers: Existing customers are price-aware. But new customers don’t know your old price, giving you room to test higher tiers without churn risk.
- Bundling: Combine multiple items or services into a package to raise perceived value. This lets you increase the effective price while giving the customer a deal on individual components.
Pro Tip: Run controlled experiments. Use A/B testing to measure not just conversion, but also downstream profit. A slightly lower conversion rate can still win if the margin gain offsets the volume drop.
Also analyze refund rates, NPS scores, and support requests post-pricing change. Price sensitivity is emotional, not just mathematical.
3. Increase Average Order Value (AOV)
Higher AOV means more revenue per order without increasing variable cost proportionally. That lifts your contribution margin without requiring more traffic or conversions.
Tactics that move the needle:
- Upsell: Encourage buyers to choose higher-end or premium versions of what they’re already considering. This adds revenue with little to no change in per-unit cost.
- Cross-sell: Suggest complementary products that share the same order (e.g., charger with phone). These are often high-margin and require no separate acquisition.
- Bundles: Create value-packed product combinations that encourage larger baskets even at a modest discount, the total contribution goes up.
Pro Tip: Track average order contribution margin, not just AOV. An upsell with slim margin might look good on revenue but underperform on profit.
4. Prioritize High-Margin Products
Not all products contribute equally, and some may be dragging your entire business down.
- Cut low-margin SKUs: Especially those that require intensive support, custom packaging, or complicated logistics. If they don’t scale profitably, they don’t belong in your core mix.
- Focus on digital or repeat-purchase products: These often have minimal marginal costs and drive recurring contributions.
- Use CM per product to allocate ad spend: Spending $5 to promote a product that only nets $4 in contribution doesn’t work even if it’s a top seller.
Pro Tip: Run a product-level contribution margin audit quarterly. It’s common to find 80/20 patterns where a small set of SKUs drive most of your actual profit.
5. Automate Where It Matters
Automation doesn’t directly change your CM ratio but it streamlines operations and reduces variable labor linked to fulfillment, support, and admin.
Quick wins:
- Auto-generate invoices and order confirmations: Removes admin overhead and reduces fulfillment delays.
- Automate shipping label creation: Especially important at scale, shaves seconds off thousands of transactions.
- Route support tickets with rules and tags: Prioritize high-value customers, triage issues faster, and reduce the human input required.
Pro Tip: Identify any repeatable process done more than 10x a day. That’s a candidate for automation, and a contributor to leaner variable cost per sale.
6. Shift Acquisition Strategy
Your CM ratio is directly shaped by how much you pay to acquire each customer. If CAC eats up your margin, you’re growing broke.
Lower-cost acquisition methods help preserve contribution:
- Referral and affiliate: Performance-based channels with built-in cost control you only pay when revenue happens.
- SEO and content marketing: High upfront investment, but cost per visitor shrinks over time. Excellent for long-term margin preservation.
- Email and owned channels: Retention-focused, zero incremental CAC. Perfect for lifting lifetime value from existing buyers.
Pro Tip: Always calculate CAC as a % of CM not just revenue. It forces discipline and keeps growth sustainable.
7. Limit Discounts
Discounts are easy to offer, and hard to recover from. Every percentage point off price comes straight out of your margin.
Alternatives that protect CM:
- Add value: Include exclusive extras (e.g., bonus items, early access, concierge support) instead of cutting price.
- Loyalty rewards or tiered pricing: Reward customers for frequency or volume, not just coupon use.
- Time-bound bundles: Shift the focus to urgency and volume rather than devaluing your offer.
Pro Tip: Run a post-promo analysis. If your average CM drops sharply during discount periods, revisit how (and why) you run sales.
8. Segment by Channel or Region
Your average CM ratio might look healthy but some segments could be bleeding margin silently.
Break it down:
- Sales channel: DTC often carries higher margins than wholesale, but also higher CAC. Marketplaces may have lower CAC but take a cut.
- Region: Shipping internationally? Customs, duties, and delivery costs might erode margin even if the top-line revenue is strong.
- Device or platform: Mobile visitors might convert faster, but could have lower AOV or higher return rates.
Pro Tip: Build a contribution margin dashboard segmented by channel, country, and device. It’ll show you where profit hides, and where it leaks.
Advanced Pricing Models
To increase your contribution margin, consider moving beyond basic price hikes, and start building pricing systems that reflect real user behavior, value perception, and business dynamics.
- Dynamic pricing adjusts your prices in real time based on demand levels, inventory status, or user segments. For example, increase prices during peak periods or reduce them for slow-moving items. This tactic helps you strike a balance between volume and margin without compromising long-term profitability.
- Tiered pricing offers multiple pricing levels based on volume, features, or customer type. In SaaS, that might look like “Starter”, “Pro”, and “Enterprise” packages. This approach lets you capture more value from different user segments without undercutting your top-tier margin.
- Psychological pricing uses perception instead of raw numbers. The classic $9.99 instead of $10 is just the beginning. Other techniques include anchor pricing, premium decoy options (“gold packages”), and value framing all designed to influence purchase decisions without sacrificing real margin.
Pro Tip: Never test pricing in isolation. Evaluate the entire offer: package name, feature mix, guarantee, and perceived value. Don’t just track conversions monitor contribution margin per order to see what really drives profitable growth.
Smart pricing strategies are often the fastest way to improve your CM ratio no need to touch production or team structure. Testing the right combinations reveals where customer willingness to pay aligns with operational efficiency.
Real-World Examples: SaaS vs. Ecommerce
Let’s look at two very different business models, and how contribution margin works in each.
SaaS Example: A project management tool charges $40/month per user. The variable costs per user include server infrastructure, customer support, and onboarding totaling about $5 per month.
- Contribution Margin = $40 – $5 = $35
- CM Ratio = $35 / $40 = 87.5%
This is a healthy CM ratio, typical for well-structured SaaS. Most of the revenue stays in the business to cover fixed costs and fuel growth. Because per-user costs are low and revenue is recurring, scaling becomes highly efficient once user acquisition is under control.
Ecommerce Example: A direct-to-consumer skincare brand sells kits for $60. Variable costs include ingredients, packaging, shipping, and fulfillment totaling $36 per order.
- Contribution Margin = $60 – $36 = $24
- CM Ratio = $24 / $60 = 40%
That’s solid for ecommerce, where fulfillment and logistics make margins thinner. The business must manage AOV, CAC, and return rates tightly to preserve profitability.
Insight:
- In SaaS, the focus is on user retention, low churn, and high LTV. Improvements often come from pricing strategy or infrastructure efficiency.
- In Ecommerce, the battle is AOV vs. CAC. Margins can be improved through bundling, logistics optimization, and smarter targeting.
Both models benefit from contribution margin improvements but the levers are entirely different.
Forecasting With CM Ratio
Once you know your contribution margin ratio, you can plug it into basic models to understand breakeven points, forecast profitability, and stress-test your growth strategy.
The most fundamental application is breakeven analysis:
Breakeven Units = Fixed Costs / Contribution Margin per Unit
Example:
- Fixed costs = $50,000
- CM per unit = $40
- Required sales = 1,250 units to breakeven
This formula gives you a baseline target, the minimum number of units you must sell to avoid losses. But CM ratio also unlocks more dynamic planning:
Scenario Modeling
You can project how profitability shifts under different conditions:
- Fixed cost increase: Hiring a new team or expanding office space? Recalculate your breakeven point to see how many extra units are needed.
- Ad budget adjustment: If you're increasing CAC through paid acquisition, you can forecast how many additional sales are needed to absorb the investment.
- Pricing changes: Raising or lowering prices affects both revenue and contribution margin per unit which changes your path to profitability.
- Cost optimization: Reducing variable costs improves CM per unit, which lowers the breakeven threshold.
Practical Tip
Build a simple spreadsheet model with adjustable variables:
- Revenue per unit
- Variable costs per unit
- Fixed costs (monthly or annual)
Use it to simulate best-case, expected, and worst-case outcomes. Run different scenarios quarterly or monthly if your cost base is volatile.
Pro Tip: Monitor not just unit-based breakeven, but also contribution margin coverage ratio:
CM Coverage Ratio = Total CM / Fixed Costs. A value >1 means you’re profitable. A value <1 signals you’re burning cash.
Final Thought
Contribution margin ratio isn’t just another line item on a report it’s the pressure gauge of your entire business model.
Across this guide, we’ve seen how the CM ratio informs pricing decisions, forecasts profitability, highlights product efficiency, and keeps growth accountable. It separates high-revenue companies that bleed cash from those that quietly accumulate leverage.
The takeaway is simple: revenue can impress, but only contribution margin can sustain. The best operators track it obsessively, optimize it relentlessly, and use it to steer every strategic call from product development to marketing spend.
It’s not about perfection. It’s about clarity.
If your CM ratio is strong, you scale with confidence. If it’s weak, you adjust early before growth exposes your inefficiencies.
Want to build a business that isn’t just bigger but smarter, leaner, and more profitable? Reach out to FNT Management. We help companies design for margin, not just momentum.